Introducing StatMando Official Rankings
StatMando has been busy digging deep into disc golf statistics for over a year. In that time, the team has devoted countless hours to developing a platform for accessing player statistics and is now happy to present a new, unique ranking system for player comparisons.
- The strength of the field; and,
- The difficulty of getting the win.
Each disc golf tournament has a unique line-up of competitors with different abilities. This is true for your local C-tier event and is even seen among pro-tour events. Some events will attract the best disc golfers in the world, whereas others may be less well attended. We at StatMando feel that this is an important consideration when evaluating the outcome of a tournament, and subsequently, how players are ranked.
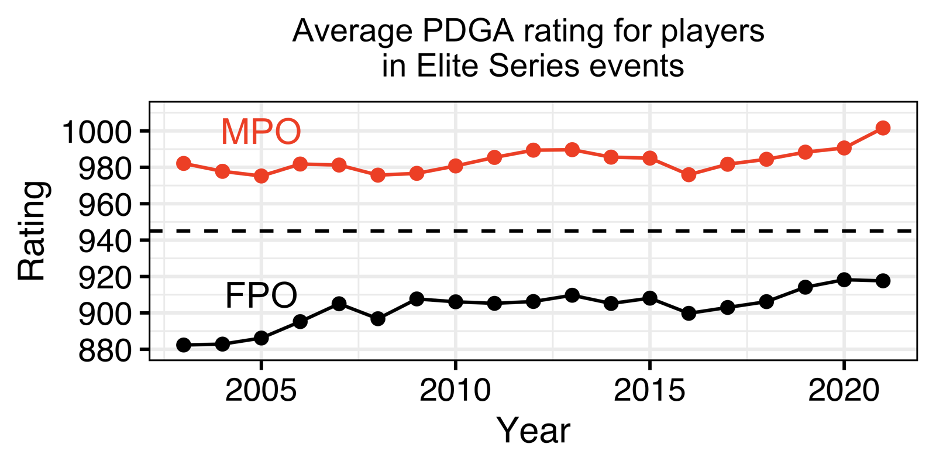
As well, never in the history of disc golf has it been more challenging to get the W then it is today. There were over 75 MPO players with a 1000+ rating and over 25 FPO players with a 920+ rating that competed in the 2022 Las Vegas Challenge alone! Given the trend over the last 20 years, we can only expect that these numbers will continue to grow. For example, the average player rating of competitors in Elite Series events* has increased 19.48 points in MPO and 35.27 points in FPO since 2003. The increasingly competitive nature of disc golf tournaments is making it more difficult to win, and as a result, getting the W should be rewarded in player rankings.
Below we go over how the new StatMando Official Rankings are calculated and give you an example based on the extraordinary Professional Disc Golf World Championship (i.e., Worlds) that we experienced last year.
The StatMando Official Rankings are calculated separately for MPO and FPO, with calculations performed in two steps. First, the field strength of each sanctioned event is calculated. Broadly, field strength describes the overall competitive ability of the players in an event based on their PDGA ratings. Using the field strength of an event, players are ranked as a function of their overall performance - the more successful that a player was, the higher their score will be.
Field strength of each event is calculated based on three metrics:- Top Tier Rating: The average PDGA rating of the Top 40 players in MPO or Top 20 players in FPO at Worlds and USDGC, combined, in the year prior to ranking consideration‡.
- Top-and-Middle Tier Rating: The average PDGA rating of the Top 80 players in MPO or the Top 40 players in FPO at Worlds and USDGC, combined, in the year prior to ranking consideration‡.
- Average Elite Series Rating: The average MPO or FPO player rating across all Elite Series events* in the year prior to ranking consideration.
Here is how we calculate the field strength of each event: Two points are awarded for each player in the field that is rated greater than or equal to the Top Tier Rating. One point is awarded for each player rated greater than or equal to the Top-and-Middle Tier Rating but below the Top Tier Rating. 0.25 points are awarded for each MPO player that is rated greater than or equal to 1000 rated but below the Top-and-Middle Tier Rating. For FPO, 0.25 points are awarded for each player that is rated greater than or equal to 900 but below the Top-and-Middle Tier Rating. 0.05 points are awarded for each MPO player rated below 1000 and below the Top-and-Middle Tier Rating. Similarly, 0.05 points are awarded for each FPO player rated below 900 and below the Top-and-Middle Tier Rating. Finally, if the average rating of the event field is greater than the Average Elite Series Rating, the Average Elite Series Rating is subtracted from the event field average, that difference is divided by three, and the resulting points are added to the total score.
This is best understood with an example. Let's consider the 2021 Worlds for the MPO division. What a ridiculously exciting and historic event that was! Calculating the field strength requires that we consider the USDGC and Worlds in 2020, however, because Worlds was not held in 2020, we used data from the 2019 Worlds. The average rating of the Top 40 players at Worlds and USDGC was 1028¥ (Top Tier Rating), the average of the Top 80 players was 1018 (Top-and-Middle Tier Rating), and the Average Elite Series Rating was 990. At the 2021 Worlds, 25 players were rated greater than or equal to 1028, netting the 2021 tournament 50 points. Thirty-three players competed in the 2021 Worlds that were rated greater than or equal to 1018 but below 1028, netting the 2021 tournament an additional 33 points. Sixty-three players competed in Worlds that were rated greater than or equal to 1000, but below 1018, netting the tournament 15.75 points (i.e., 63 * 0.25). Eighty-six players competed in Worlds that were below 1000 rated netting 4.3 points (i.e., 86 * 0.05). Finally, the average player rating in the 2021 Worlds was 1002, which is greater than the Average Elite Series Rating of 990. Therefore, 3.8557 points were added to the field strength score [(1002.2029 - 990.6359) / 3]. In total, the field strength of the 2021 Worlds was rated:
- 50 + 33 + 15.75 + 4.3 + 3.8557 = 106.9057 points (rounded to 4 decimal places).
With the field strength for Worlds calculated, we can go ahead and assign points to each player that participated. This is where winners are rewarded – the winner of Worlds, in this case James Conrad, receives the full 106.9057 points identified in the field strength calculation. As we go down the leaderboard, competitors receive fewer and fewer points:
| Place | Percent of Field Strength |
Total Points Received |
|---|---|---|
| 1 | 100% | 106.9057 |
| 2 | 60% | 64.1434 |
| 3 | 38% | 40.6242 |
| 4 | 27% | 28.8645 |
| 5 | 22% | 23.5193 |
| 10 | 15% | 16.0359 |
| 20 | 9.0% | 9.6215 |
| 30 | 5.6% | 5.9867 |
| 40 | 3.2% | 3.4210 |
| 50 | 1.7% | 1.8174 |
| 60 | 1.0% | 1.0691 |
| 70 | 0.6% | 0.6414 |
Only the Top 70 spots get points. When a tie occurs, points are averaged across the tied positions and each player receives that average. For example, Kevin Jones and Chris Dickerson tied for 4th place at the 2021 Worlds. The total number of points awarded to each player would be 26.1919, 24.5% of the total event field strength [(0.27 + 0.22) / 2 = 0.245 * 106.9057].
This example demonstrates how the ranking of players is calculated for a single event. However, each player's ranking is based on the top 20 scores from events that took place over the last two years. The most recent events will be worth the most – events that occurred after 13 weeks since the current rating are slowly penalized over time. Specifically, a player’s event rating is penalized an equal percentage (~1.09%) each week from 14 weeks to 104 weeks (2 years). For example, Worlds ended on June 26, 2021, about 35 weeks before this article was written (still seems like yesterday!). Therefore, the 106.9057 points that was earned by James Conrad is now only worth 82.9257 points [106.9057 – (35-13) * 1.09]. Compare this to Paul McBeth’s 2nd place finish, which is now only worth 40.1634 points. This degradation over time in score rewards players that are continuously placing high throughout the year.
After all the field strengths are calculated and rankings for players are summed across their 20 top finishes, player rankings are multiplied by 100 for MPO and 2500 for FPO to place each on a similar scale. Although the scales may be somewhat similar between MPO and FPO, they cannot be compared – MPO and FPO have different field strengths.
As a stats-loving group of disc golfers, StatMando appreciates all the player ranking systems that have been developed. As such, we included a page on our website that allows you to access and compare across the various rating systems to get a full picture of current landscape of player ratings. Furthermore, we expect that our rating system will be revised over time to incorporate new data that become available.
- * Elite series events include events from the National Tour and Disc Golf Pro Tour.
- ‡ If there was no Worlds or USDGC in a previous year then the previous year from that is used. For example, there was no Worlds in 2020 and, therefore, the field strength was calculated using data from 2019.
- ¥ Values have been rounded down for simplicity but are not rounded in true calculations.